File:Fig2A-01.jpg
From Bioblast
Size of this preview: 800 × 241 pixels. Other resolutions: 2,560 × 771 pixels | 7,869 × 2,369 pixels.
Original file (7,869 × 2,369 pixels, file size: 1.74 MB, MIME type: image/jpeg)
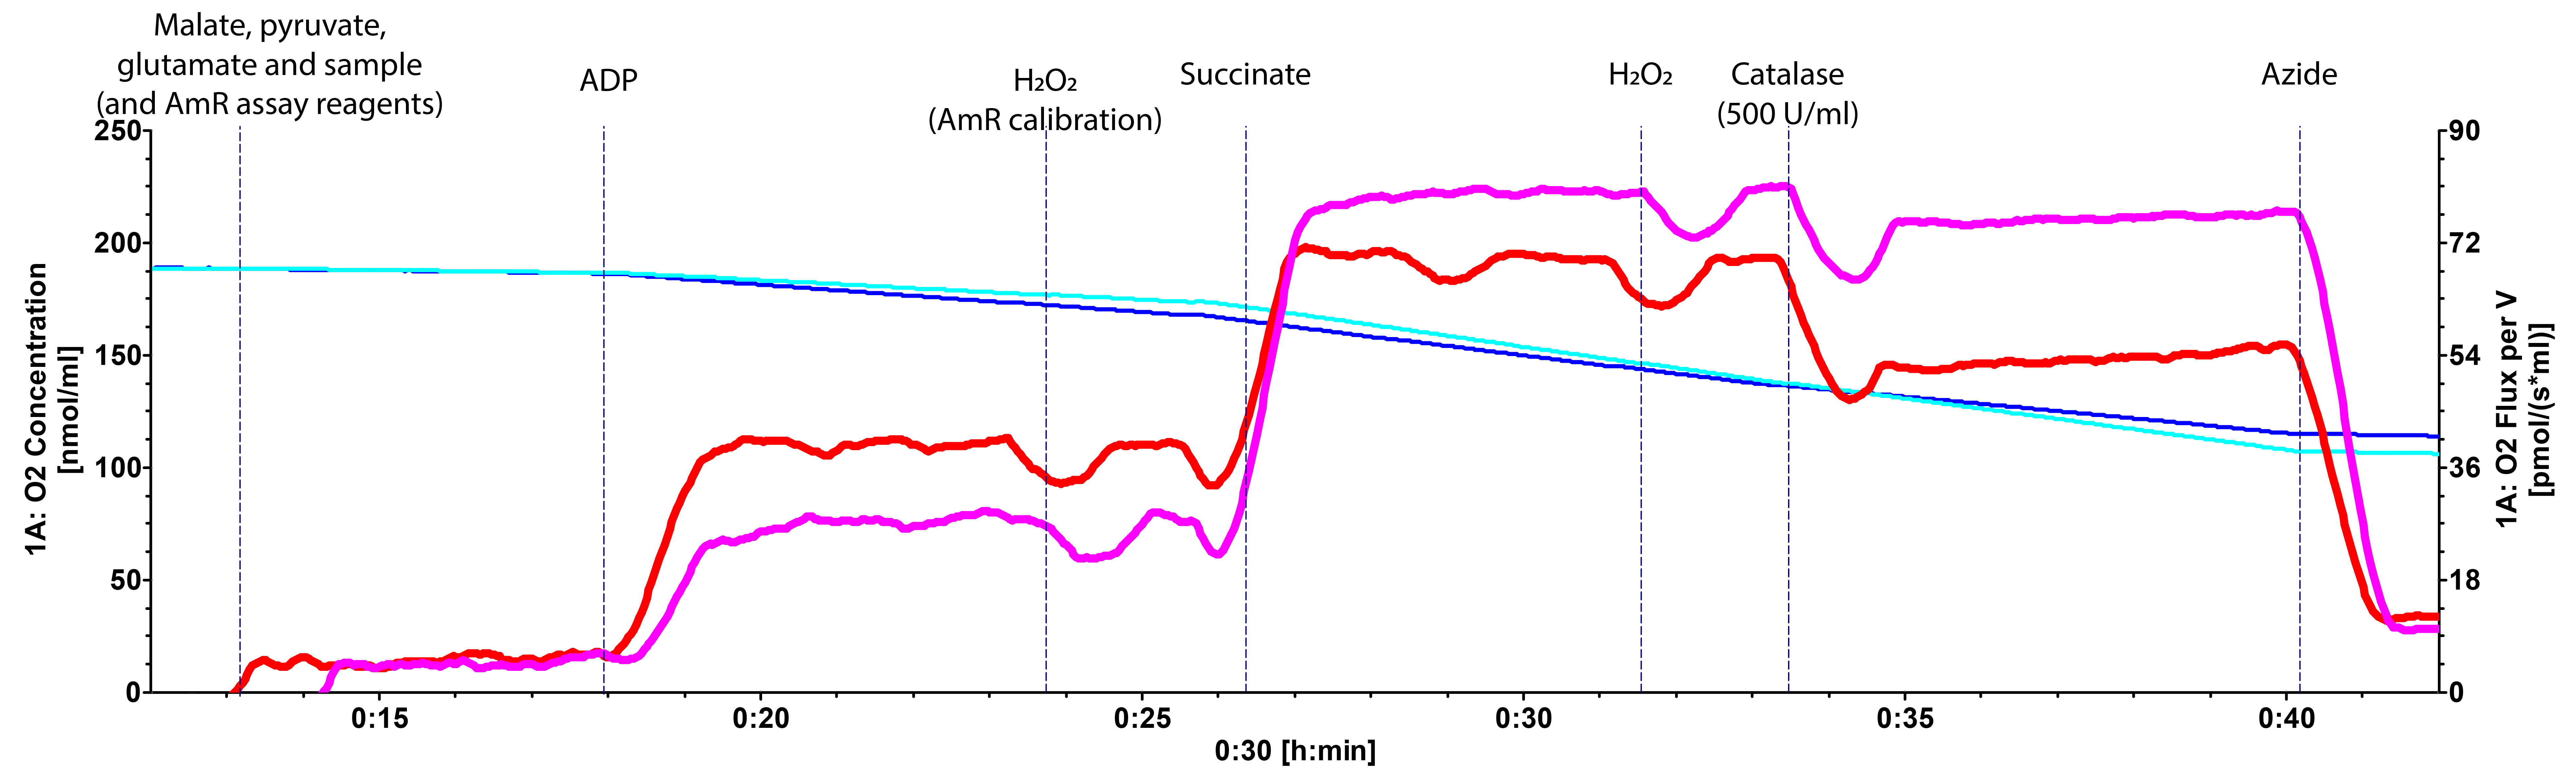
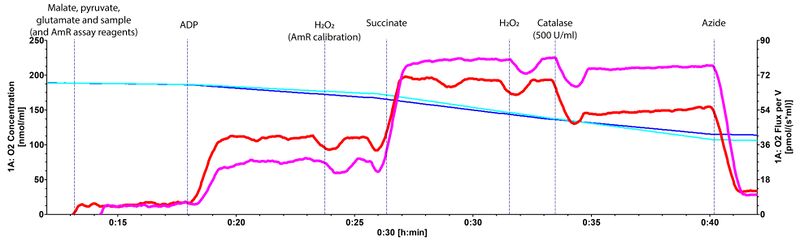
Figure 2. Genotype and tissue-dependent effect of catalase or its impurities on CI&CII-linked respiration. (A) Isolated kidney mitochondria. (B) Isolated liver mitochondria. A magenta coloured line represents a respirometry trace from a wild type mouse and red line from a mouse with a mitochondrial defect.
Contribution to the discussion forum by J. Purhonen.
File history
Click on a date/time to view the file as it appeared at that time.
| Date/Time | Thumbnail | Dimensions | User | Comment | |
|---|---|---|---|---|---|
| current | 09:43, 3 July 2017 | 7,869 × 2,369 (1.74 MB) | Krumschnabel Gerhard (talk | contribs) | Figure 2. Genotype and tissue-dependent effect of catalase or its impurities on CI&CII-linked respiration. (A) Isolated kidney mitochondria. (B) Isolated liver mitochondria. A magenta coloured line represents a respirometry trace from a wild type mouse... |
You cannot overwrite this file.
File usage
The following page uses this file: