File:Air calibration.png

Original file (1,514 × 479 pixels, file size: 42 KB, MIME type: image/png)
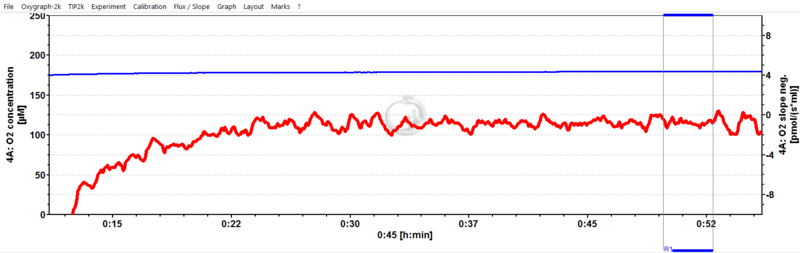
Oxygen concentration (blue plot; 180 µM; scale from 0 to 250 nmol/ml or 0 to 250 µM) over 1 h after switching on the Oxygraph-2k (Power-O2k P4, chamber A) and setting the experimental temperature at 37 °C, using medium stirred for equilibration with a gas phase of air at 575 m altitude. The red plot is the negative slope of oxygen concentration over time [pmols1ml-1] on the right Y-axis, with zero in the middle position. A slope of zero (for uncorrected ‘O2 Slope neg.’) indicates a constant O2 signal over time. 2014-07-24 P4-01.DLD
File history
Click on a date/time to view the file as it appeared at that time.
| Date/Time | Thumbnail | Dimensions | User | Comment | |
|---|---|---|---|---|---|
| current | 09:33, 14 August 2017 | 1,514 × 479 (42 KB) | Krumschnabel Gerhard (talk | contribs) | Oxygen concentration (blue plot; 180 µM; full scale 50 nmol/ml or 50 µM) over 1 h after switching on the Oxygraph-2k (Power-O2k P6, chamber A) and setting the experimental temperature at 37 °C, using medium stirred for equilibration with a gas phase... |
You cannot overwrite this file.
File usage
The following page uses this file: